Graphist
Build responsive bar, line, pie and area charts inside Elementor, with visual controls, CSV and Excel imports, and data updates for clearer reporting.
Instant access Original unmodified files Free future updates
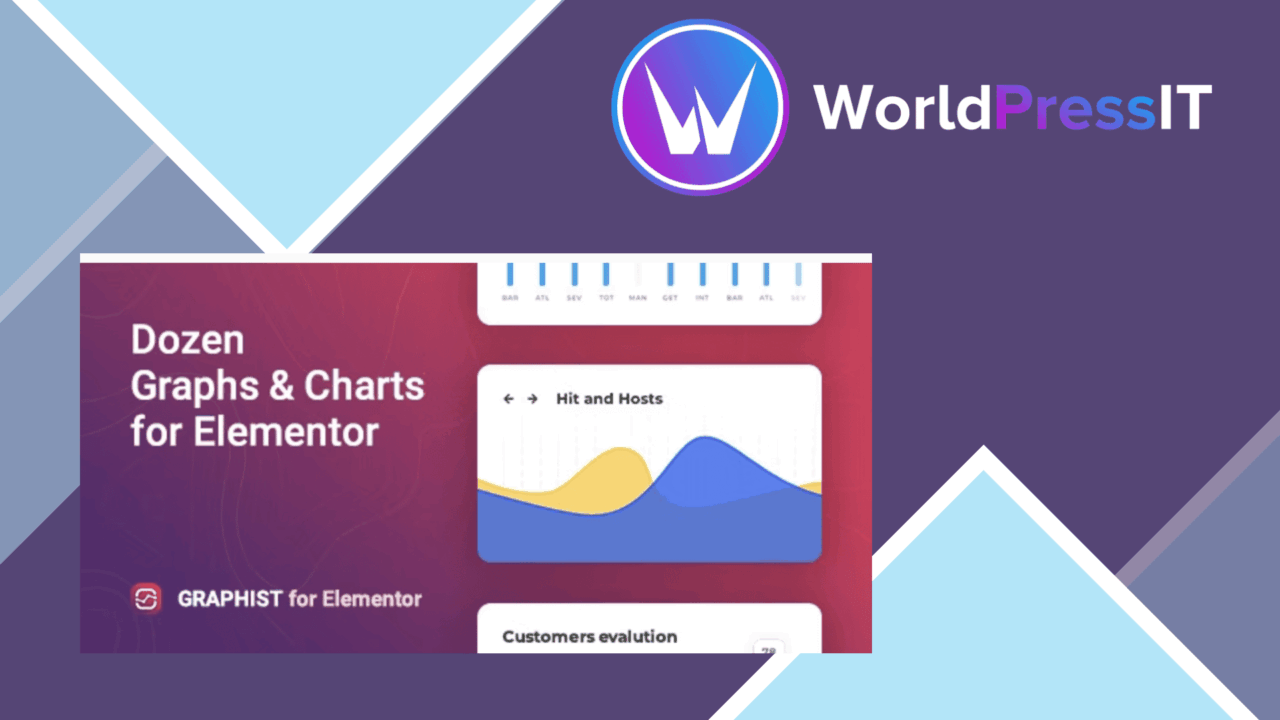
Elementor sites gain a dedicated set of chart and graph widgets with Graphist. It is aimed at presenting quantitative information inside page layouts rather than leaving readers to interpret dense tables or paragraphs. The plugin targets bloggers, business owners and data analysts who want to assemble visualisations without writing code.
Charts inside Elementor
The central appeal is the placement of chart creation within the Elementor editing experience. Instead of treating a graph as a separate embed or an isolated page, you can add it as part of the same layout used for headings, text, images and other page elements. That makes Graphist a practical fit for reports, comparison pages, business presentations and content that needs figures to sit beside an explanation.
The advertised chart selection covers the common formats most sites need:
- Bar charts for comparing categories or groups.
- Line charts for showing movement across a sequence.
- Pie charts for displaying parts of a whole.
- Area charts for combining trend lines with a filled visual treatment.
This is a sensible starting range. It gives an editor several ways to express the same dataset, with the format chosen according to whether comparison, proportion or change matters most.
Control over presentation
Graphist puts emphasis on customisation rather than a fixed chart appearance. Its design options are intended to help charts match the surrounding WordPress theme, so a visualisation does not have to look like an unrelated object dropped into the page. The drag-and-drop interface also keeps the work within a visual workflow, which suits users who are comfortable arranging Elementor sections but do not want to handle chart code.
That control is useful for more than decoration. Consistent colours and sizing help readers connect a chart to the rest of the page, while the choice between bar, line, pie and area formats gives the data a clearer visual structure.
Data and device support
CSV and Excel import options provide a quicker route to populating a chart than entering every value manually. This matters for business figures and other datasets that already exist in a spreadsheet. Graphist also lists real-time data updates, a useful feature for pages where the displayed numbers need to remain current rather than becoming a static snapshot.
Responsive design is another practical part of the feature set. Charts are intended to remain usable across different screen sizes, which is important for pages viewed on phones as well as larger desktop displays. The exact behaviour of each chart at narrow widths is not described, so the layout still deserves attention during page editing.
What to weigh
Graphist is closely tied to Elementor. That is an advantage for Elementor users, but it narrows the plugin’s audience: sites built with another page builder, the block editor or custom templates do not get the same editing workflow. Choosing it therefore also means accepting Elementor as the place where these visualisations are assembled.
The advertised import support names CSV and Excel files, not a wider set of data connections. Sites that need charts fed from a live database, an external service or a specialised reporting system should verify that their data path is covered before planning around the plugin. Real-time updates are listed as a feature, but the supplied information does not explain the source or refresh process. Finally, extensive design controls bring a little more editorial work: selecting a chart type, matching its styling and checking its responsive presentation remains the editor’s responsibility.
Who it suits
Graphist makes the most sense for an Elementor site that needs polished, embedded data visuals without a coding-led workflow. Bloggers can use it to support explanations with charts, business owners can present figures in a branded page layout, and analysts can turn spreadsheet data into more accessible presentations. It is less compelling for sites that do not use Elementor or require a documented connection to a particular external data source. Within its intended editor, the combination of familiar chart types, spreadsheet imports, custom styling and responsive output gives it a focused role.
The verdict
Download Graphist and see for yourself
You get the full Graphist release (v1.2.10), ready to install, plus every update that follows. One click and it is yours.
Download Graphist v1.2.10- Instant download
- Original developer files
- Updated 17 Nov 2026
Related reviews
Browse allHoneycombs Addon For Elementor
Hexagonal content modules for Elementor, with controls for size, spacing, colour and typography across responsive, retin…

ThePlus Add-on for Elementor Page Builder
Add more than 50 Elementor widgets, templates and design controls to build responsive pages with animations, hover effec…
Brizy Pro
A visual WordPress and cloud site builder for creating branded pages, pop-ups and forms with templates, AI assistance an…